W2: Contagion
CS300b – Agent Modeling
Week 2 – Contagion
Scene of the movie Outbreak (1995).
Contagion
- The spread of contagions is a significant area of research across various fields.
- Epidemiologists and ecologists study disease spread.
- Social scientists focus on the spread of ideas and behaviors.
- Marketers analyze product and innovation adoption.
Contagion
- We will explore contagion dynamics.
- It primarily uses agent-based models (ABMs) but also introduces mathematical models.
- This dual approach aims to provide a comprehensive understanding of contagion phenomena.
Diffusion of Innovations
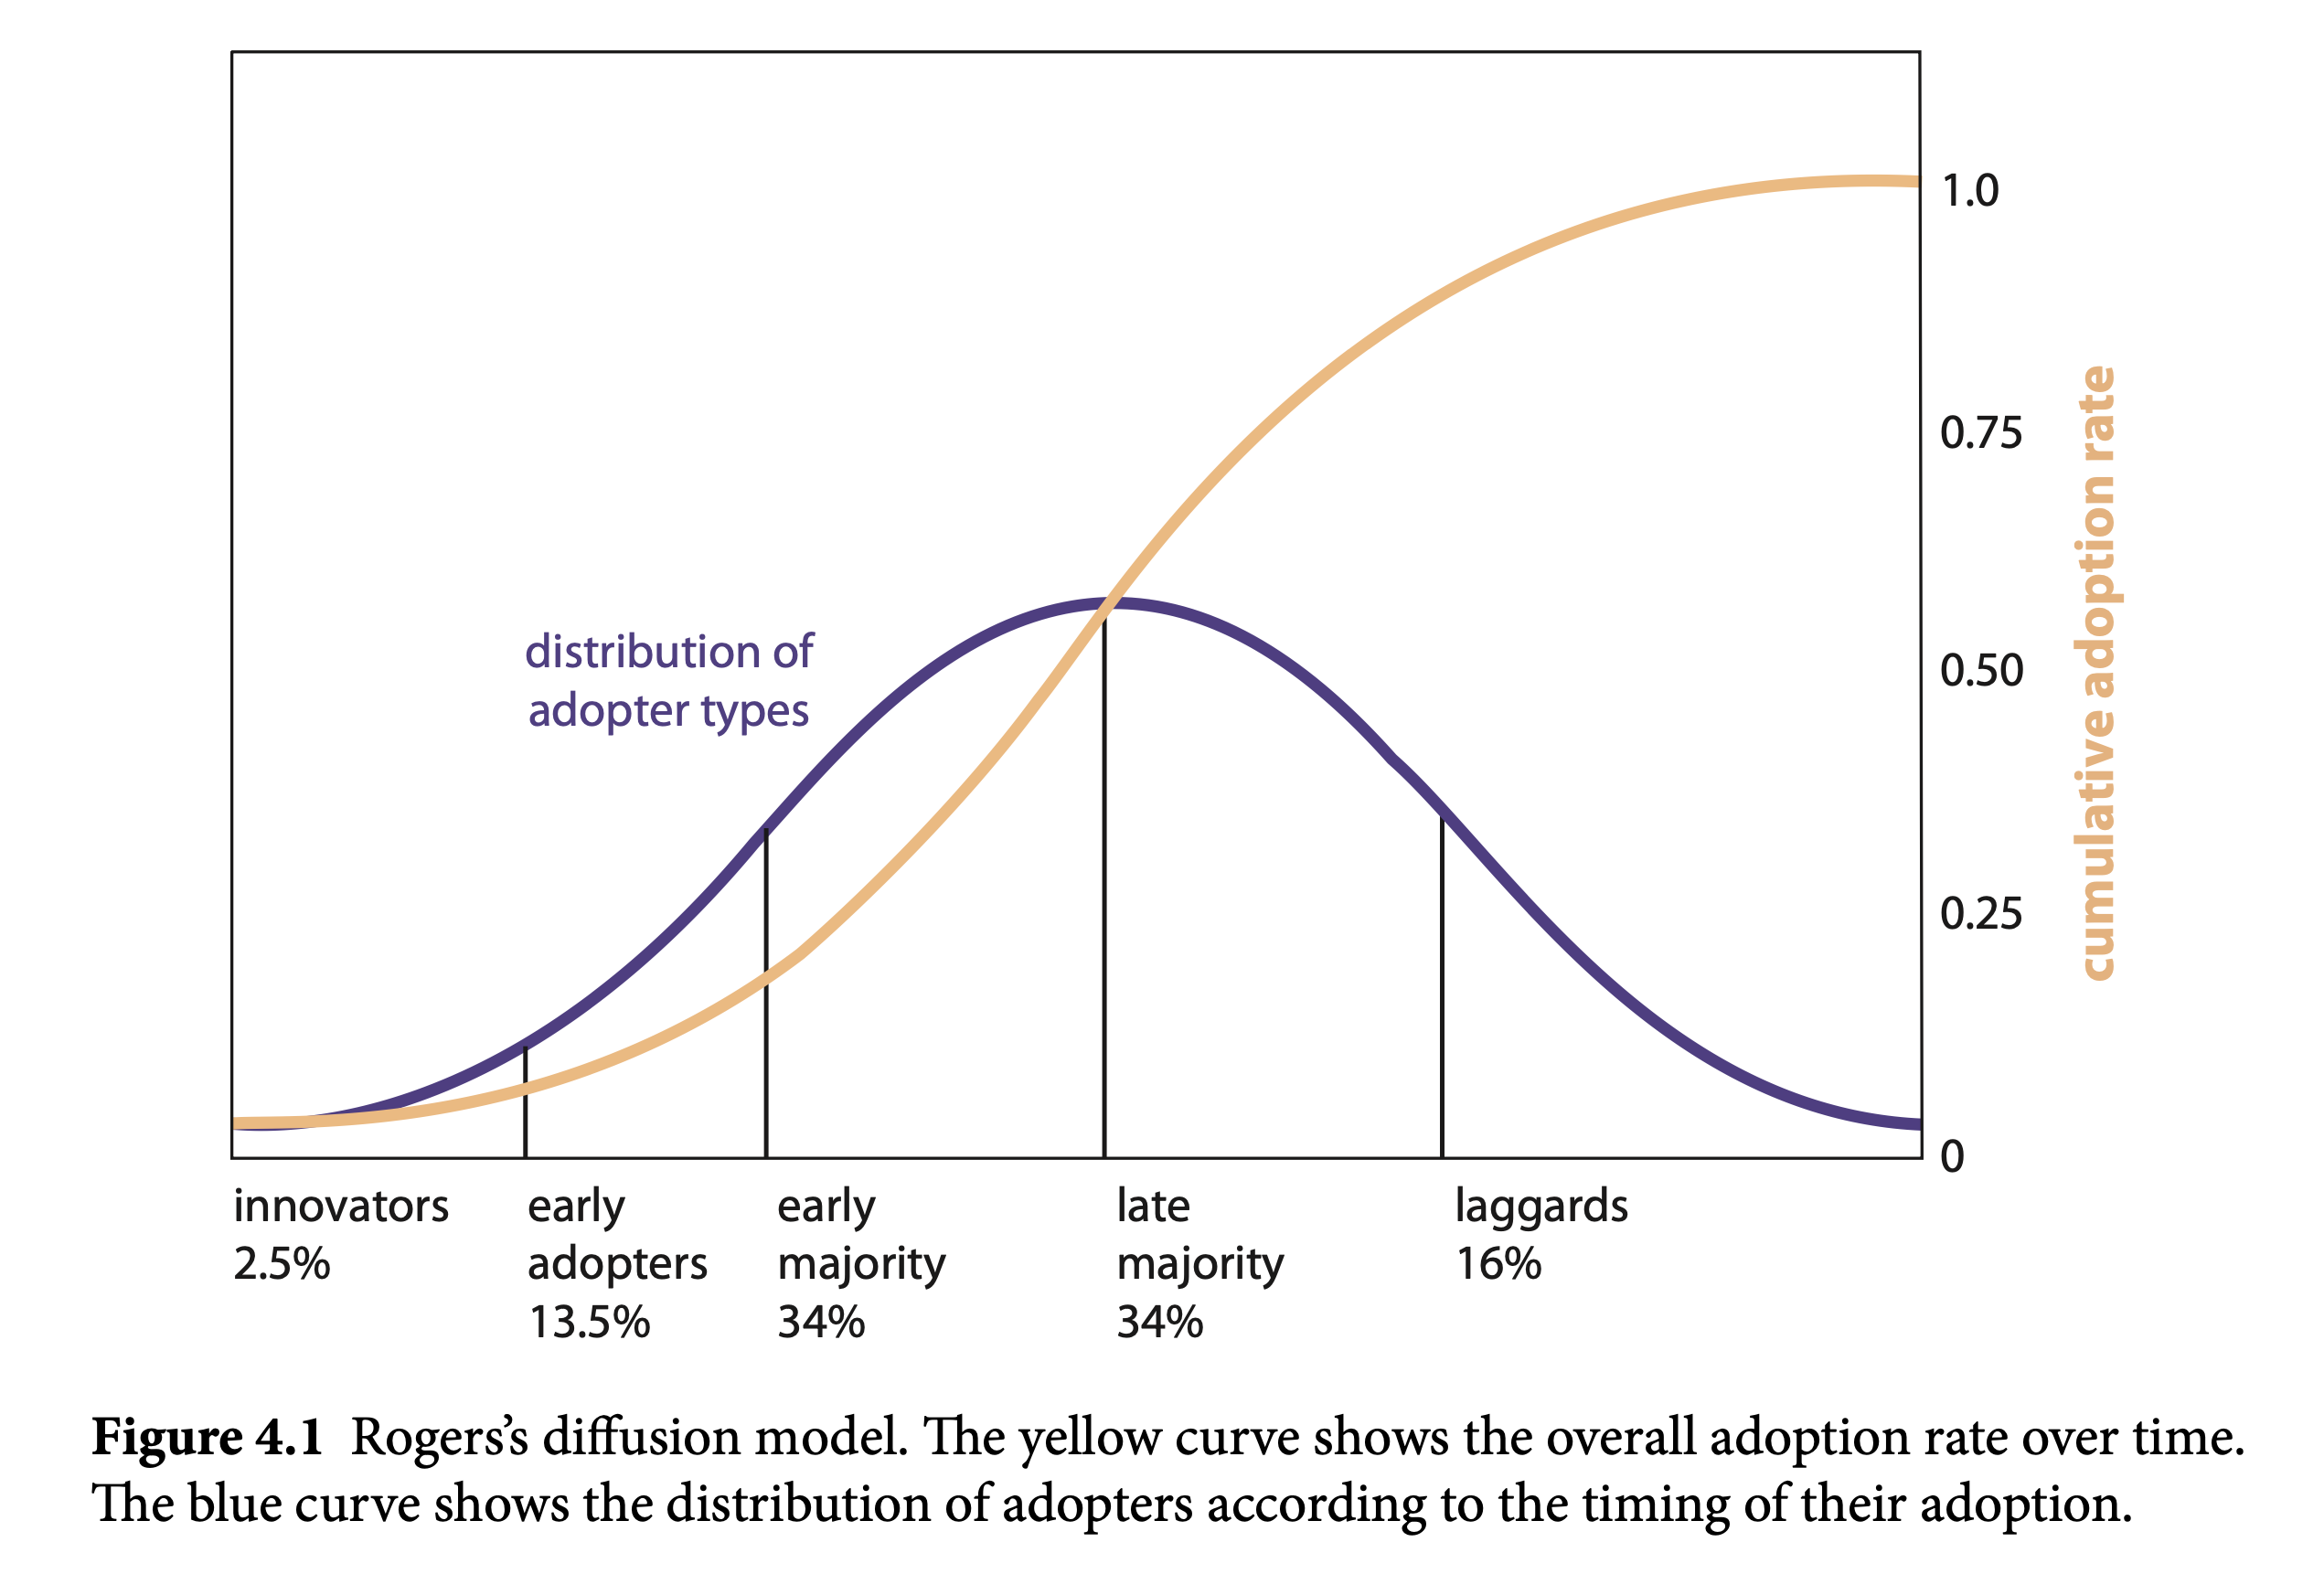
Diffusion of Innovations
- Spontaneous Adoption Model:
- N is the number of agents.
- This model assumes a fixed probability (\(\alpha\)) of individuals adopting an innovation per unit time.
- The change in the number of adopters (\(\Delta I\)) is proportional to the product of \(\alpha\) and the number of potential adopters:
- \(\Delta I = I_{t+1} - I_t = \alpha(N - I_t)\).
- This model can be simulated in NetLogo or solved analytically.
Social Influence: The SI Model

The SI Model - Analytical Model
Because individuals meet at random, the probability of a susceptible person meeting an infected person is given by:
\(Pr(S,I)=\frac{I}{N}\big(\frac{N-I}{N}\big)\)
Therefore, the chance of infection is given by:
\(Pr(infection)=\tau Pr(S,I)\)
\(Pr(infection)=\tau \frac{I}{N}\big(\frac{N-I}{N}\big)\)
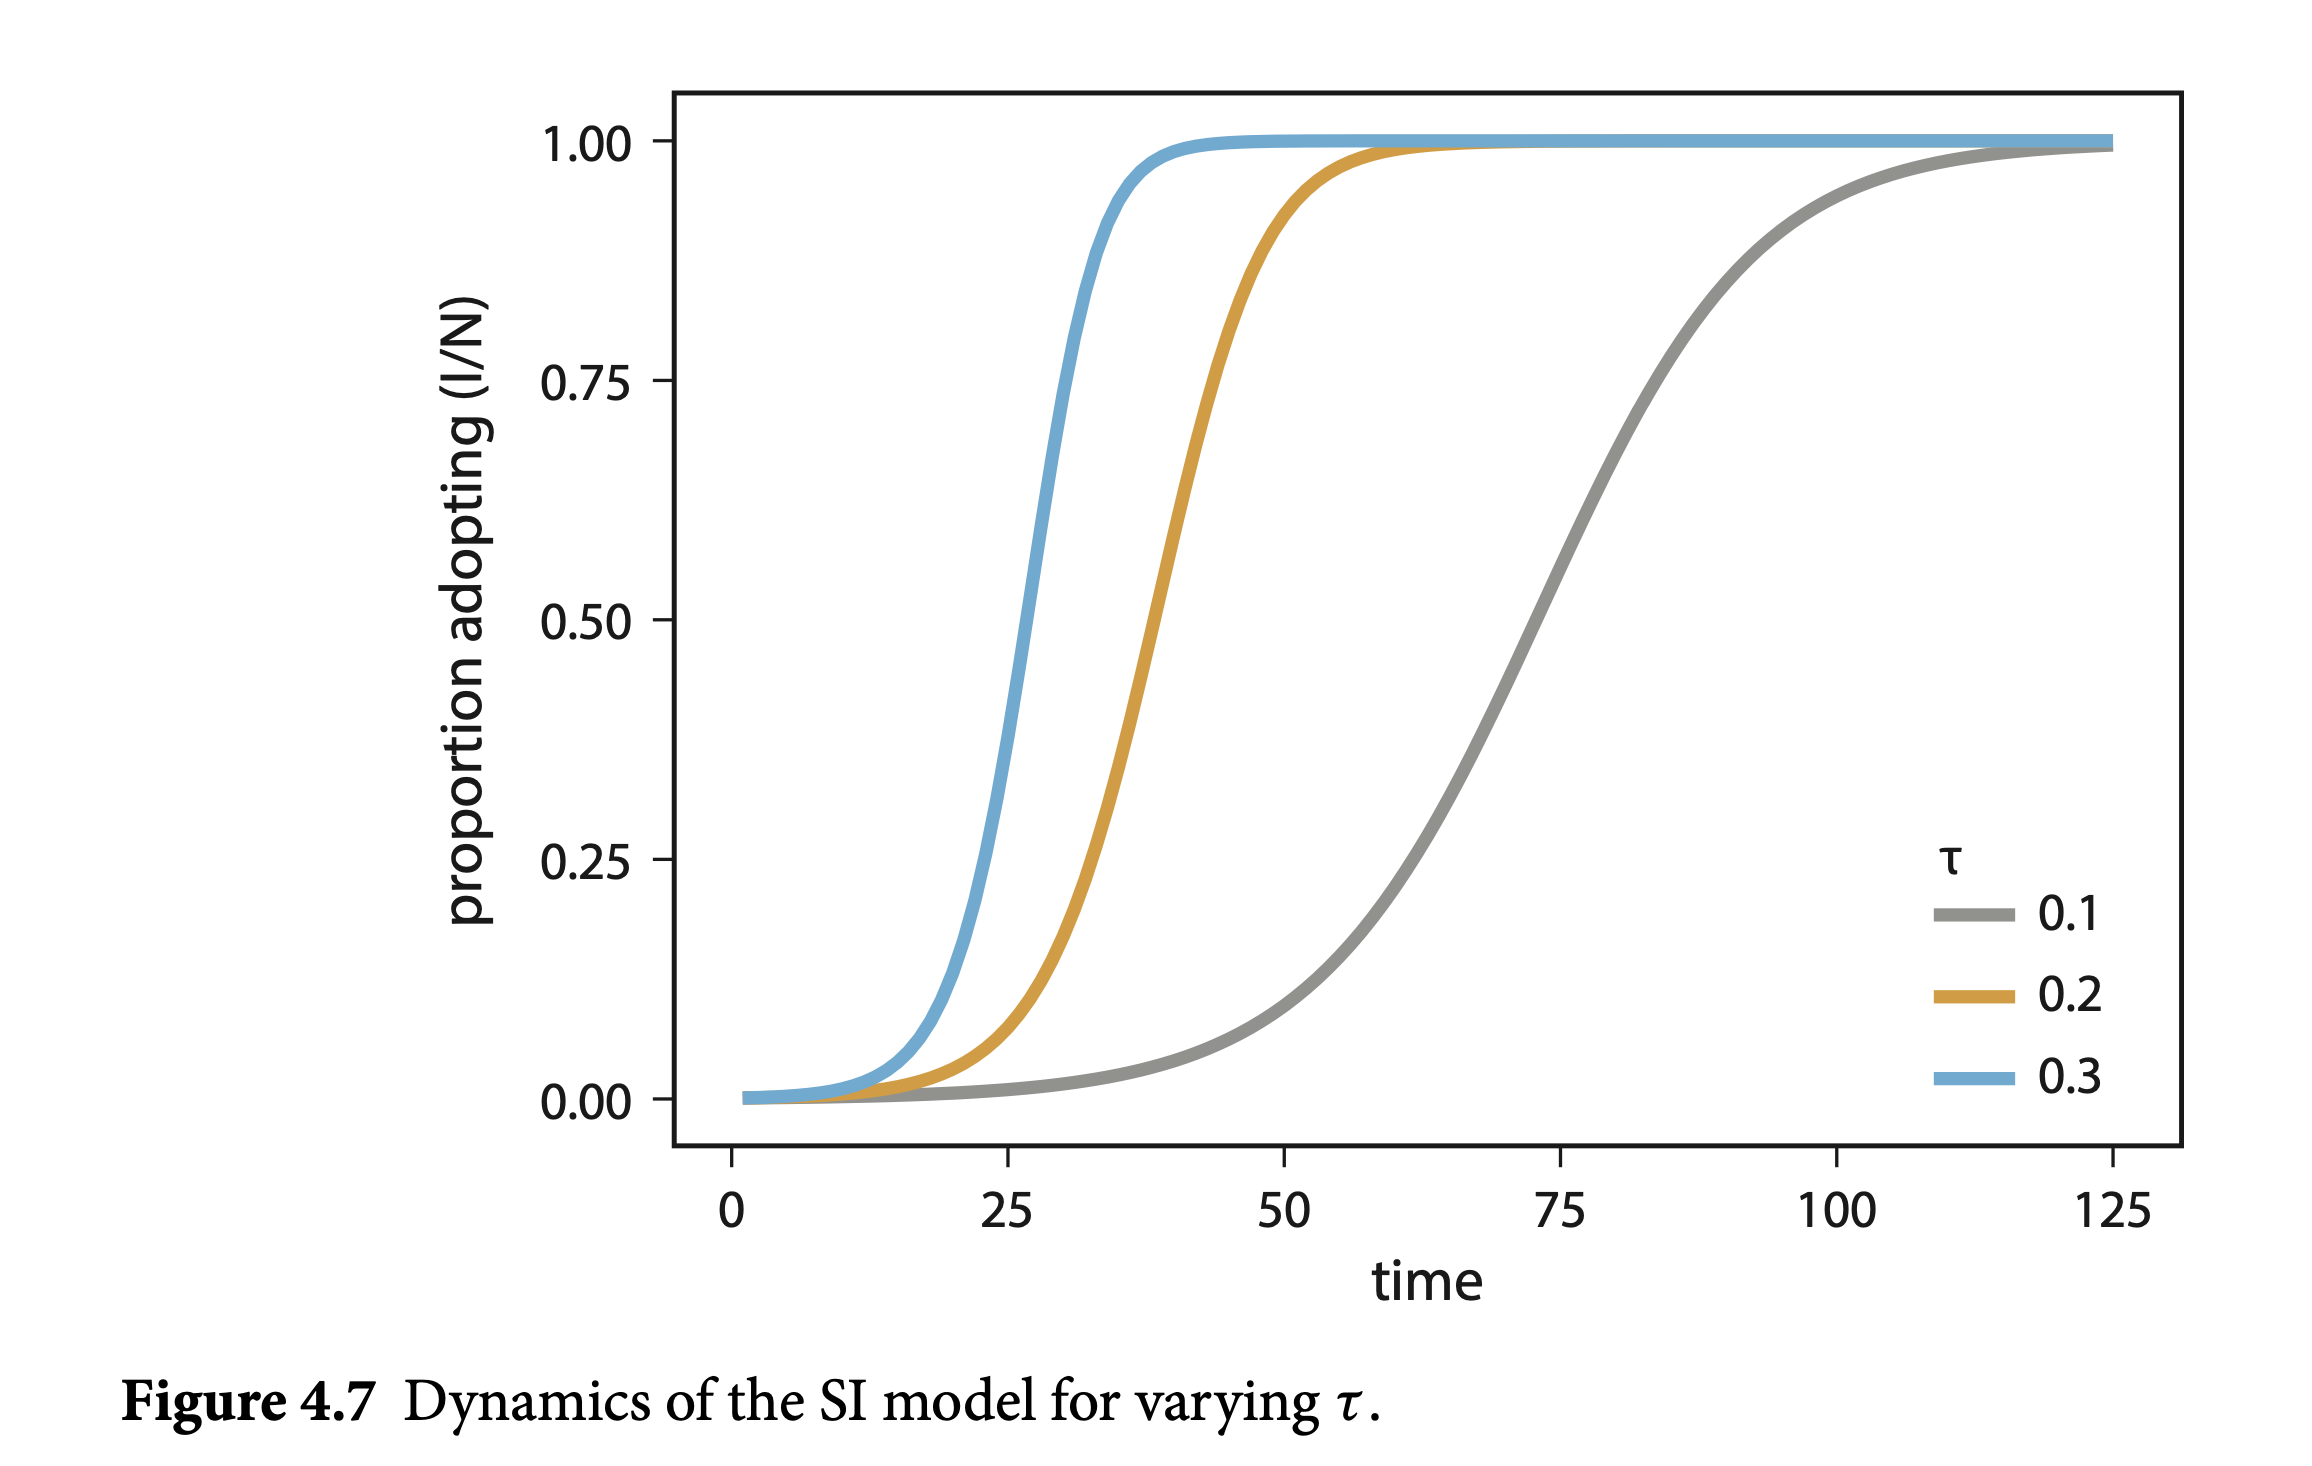
The dynamics of infections are given as follows:
\(I_{t+1} = I_t + N \tau \frac{I_t}{N}\big(\frac{N-I_t}{N}\big)\)
The SI Model - Analytical Model (simplified)
\(I_{t+1} = I_t + \tau I_t\big(1-\frac{I_t}{n}\big)\)
The SI Model - ABM
Transmissibility is caused by multiple neighbors who are infected at a rate of infection \(\tau\).
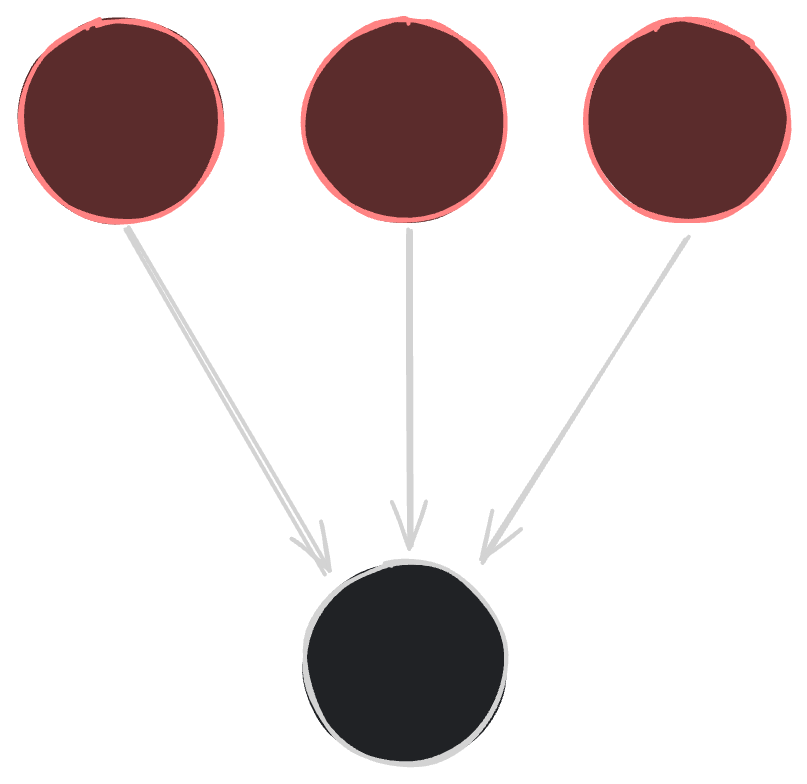
\(Pr(infection)=1-(1-\tau)^n\)
The SIS Model
- The SIS (susceptible-infected-susceptible) model adds recovery to the SI model.
- Infected individuals recover with a fixed probability (\(\gamma\)) per unit time.
- The SIS model explores the balance between infection and recovery.
The SIS Model
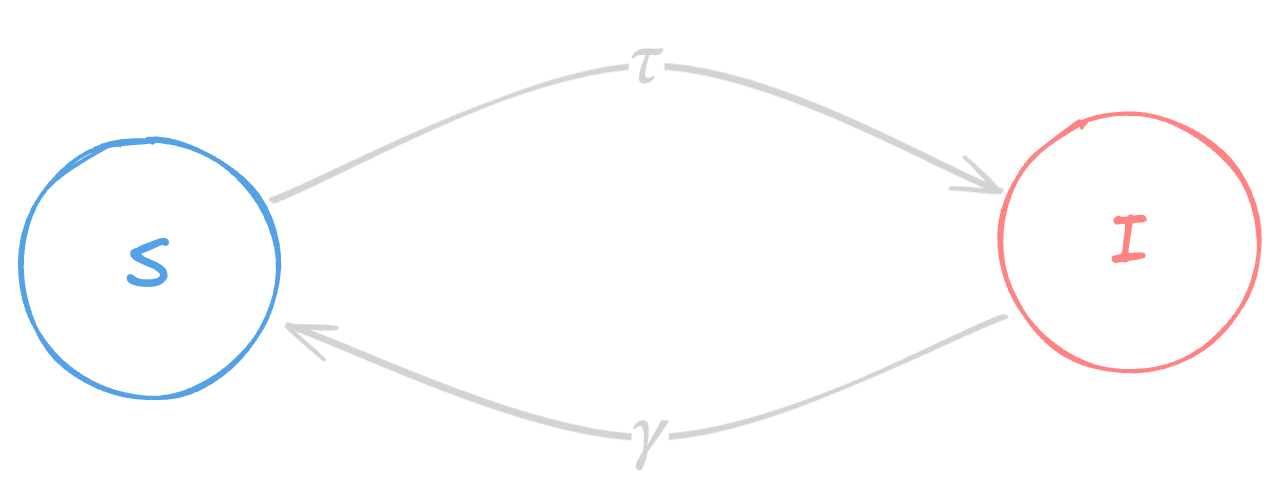
\(I_{t+1}=I_t+\tau I_t\big(1-\frac{I_t}{N}\big)-\gamma I_t\)
The SIS Model - Equilibrium
Dynamic equilibrium happens when the number of people getting infected equals the number of people getting recovered – \(I_t = I_{t+1} = I\).
\[I = I + \tau I\big(1-\frac{I}{N}\big)-\gamma I\]
\[ \boxed{\frac{I}{N} = 1 - \frac{\gamma}{\tau}} \]
\(R_0\) and Herd Immunity
\[R_0 = \frac{\tau}{\gamma} > 1\]
- R-naught or basic reproduction number
- Social and behavioral measures can change \(R_0\).
\(R_0\) and Herd Immunity
\[\frac{\tau}{\gamma}(1-V) > 1\]
- V is the proportion of vaccinated people.
- This is the threshold vaccination rate for herd immunity:
\[V^* = 1 - \frac{1}{R_0}\]
The SIR Model

- The SIR (susceptible-infected-recovered) model incorporates permanent immunity or removal.
- Recovered individuals are no longer susceptible to infection.
- The SIR model is often used to study epidemics with lasting immunity.
The SIR Model
- \(\Delta S = -\tau S\frac{I}{N}\)
- \(\Delta I = \tau S\frac{I}{N} - \gamma I\)
- \(\Delta R = \gamma I\)
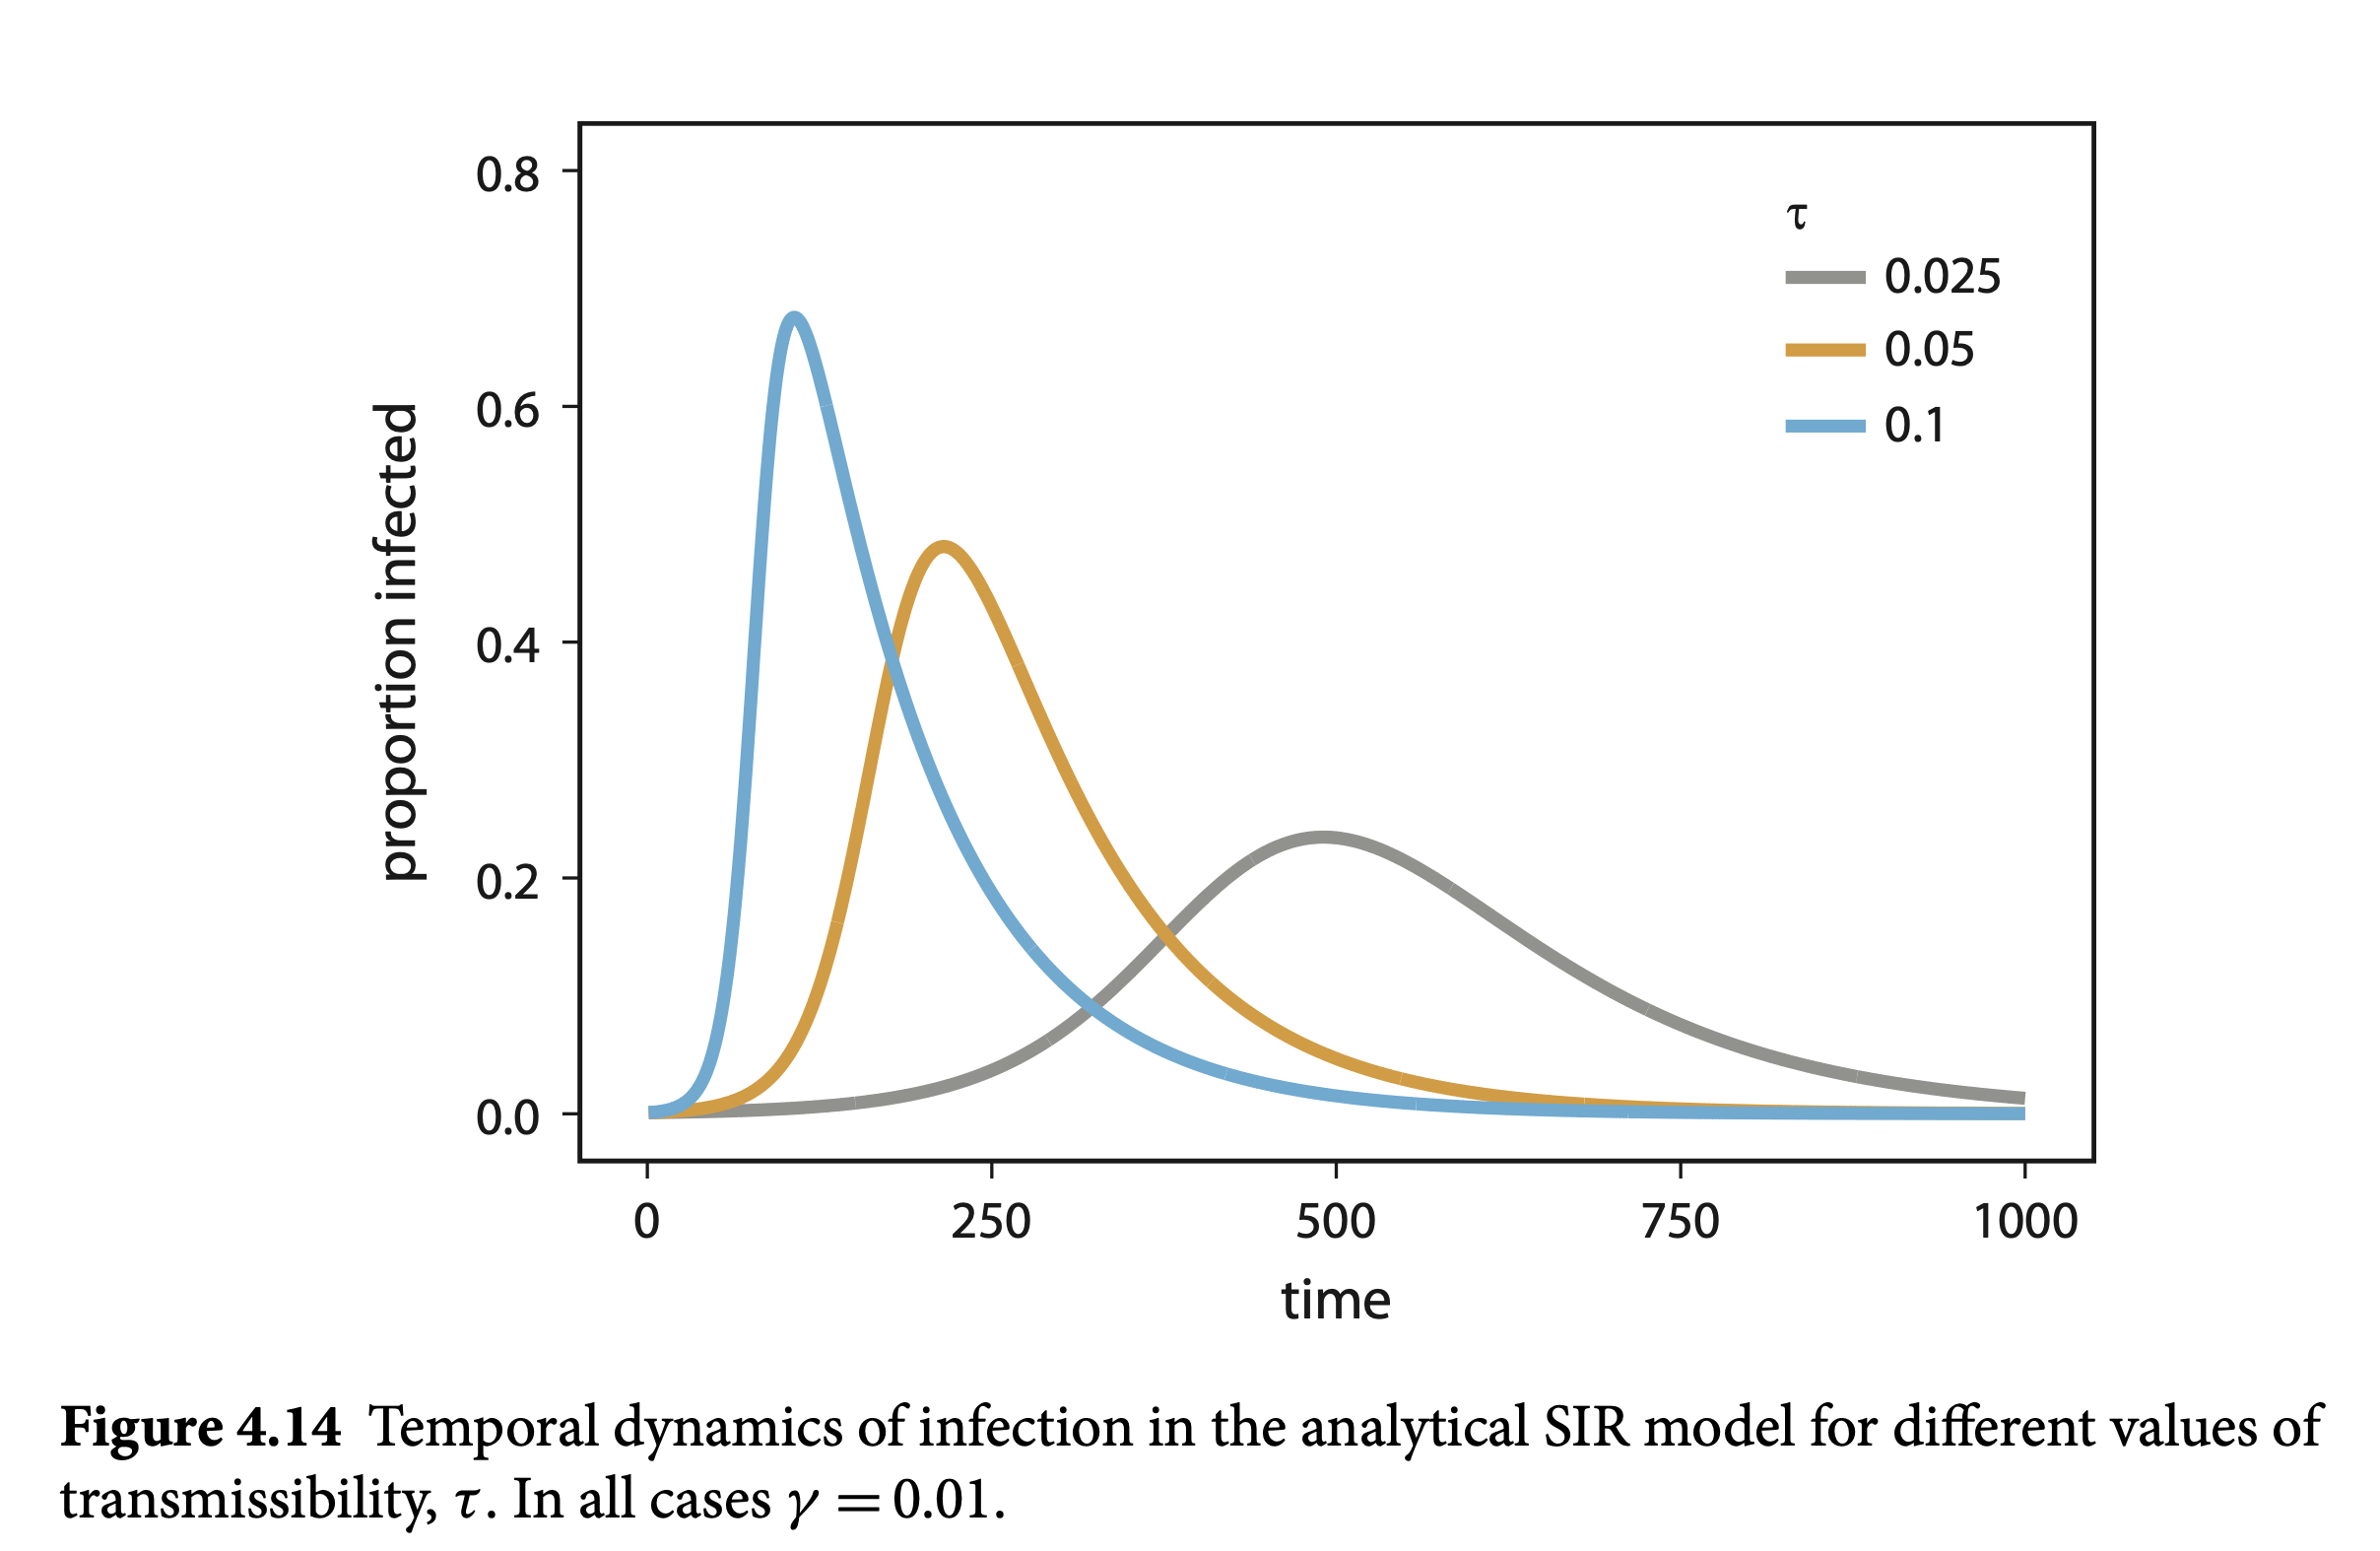
Flattening the Curve
- The SIR model illustrates the concept of “flattening the curve”.
- Reducing transmissibility (\(\tau\)) through interventions like social distancing can lower the peak infection rate.
- This prevents overwhelming healthcare systems and provides time for treatment development.
Flattening the Curve
Limitations of Simple Contagion Models
- We must ackwnoledge the limitations of the presented models.
- Individual variation in transmission, adoption, and recovery is not considered.
- Models assume random interactions, ignoring population structure and mobility patterns.
- Cultural norms, socioeconomic factors, and identity are not accounted for.
Simple vs. Complex Contagion
- Simple contagions, like diseases, spread through single contact.
- Complex contagions require multiple contacts for adoption, often involving social reinforcement.
- This concept was introduced by Centola and Macy (2007).
- Examples include the spread of certain behaviors, beliefs, and innovations.
Compartment Models
- The SI, SIS, and SIR models belong to a family of models known as compartment models
- The groups of individuals are compartmentalized in the different categories each model provides
- There are limitations!
Social Influence: The SI Model