In this section, we will build a SIR model, which is a more realistic representation of disease spread. In this model, agents can be in one of three states: Susceptible (S), Infected (I), or Recovered (R). Susceptible agents can become infected upon contact with infected agents, and infected agents can recover after a certain period, gaining immunity.
We will keep the same basic structure as before, but we will add a few more features to account for the different states of the agents. We will also implement a way to track the number of agents in each state over time, as well as visualize the results using plots.
Model Setup
We will start by defining the model parameters. We will need to define the infection probability, recovery probability, and the initial number of infected agents. We can use sliders to allow the user to adjust these parameters. Some of the global variables necessary for this model may be created in the Interface tab, but we will also need to define some additional global variables in the Code tab. The final interface for this simulation can be seen below:
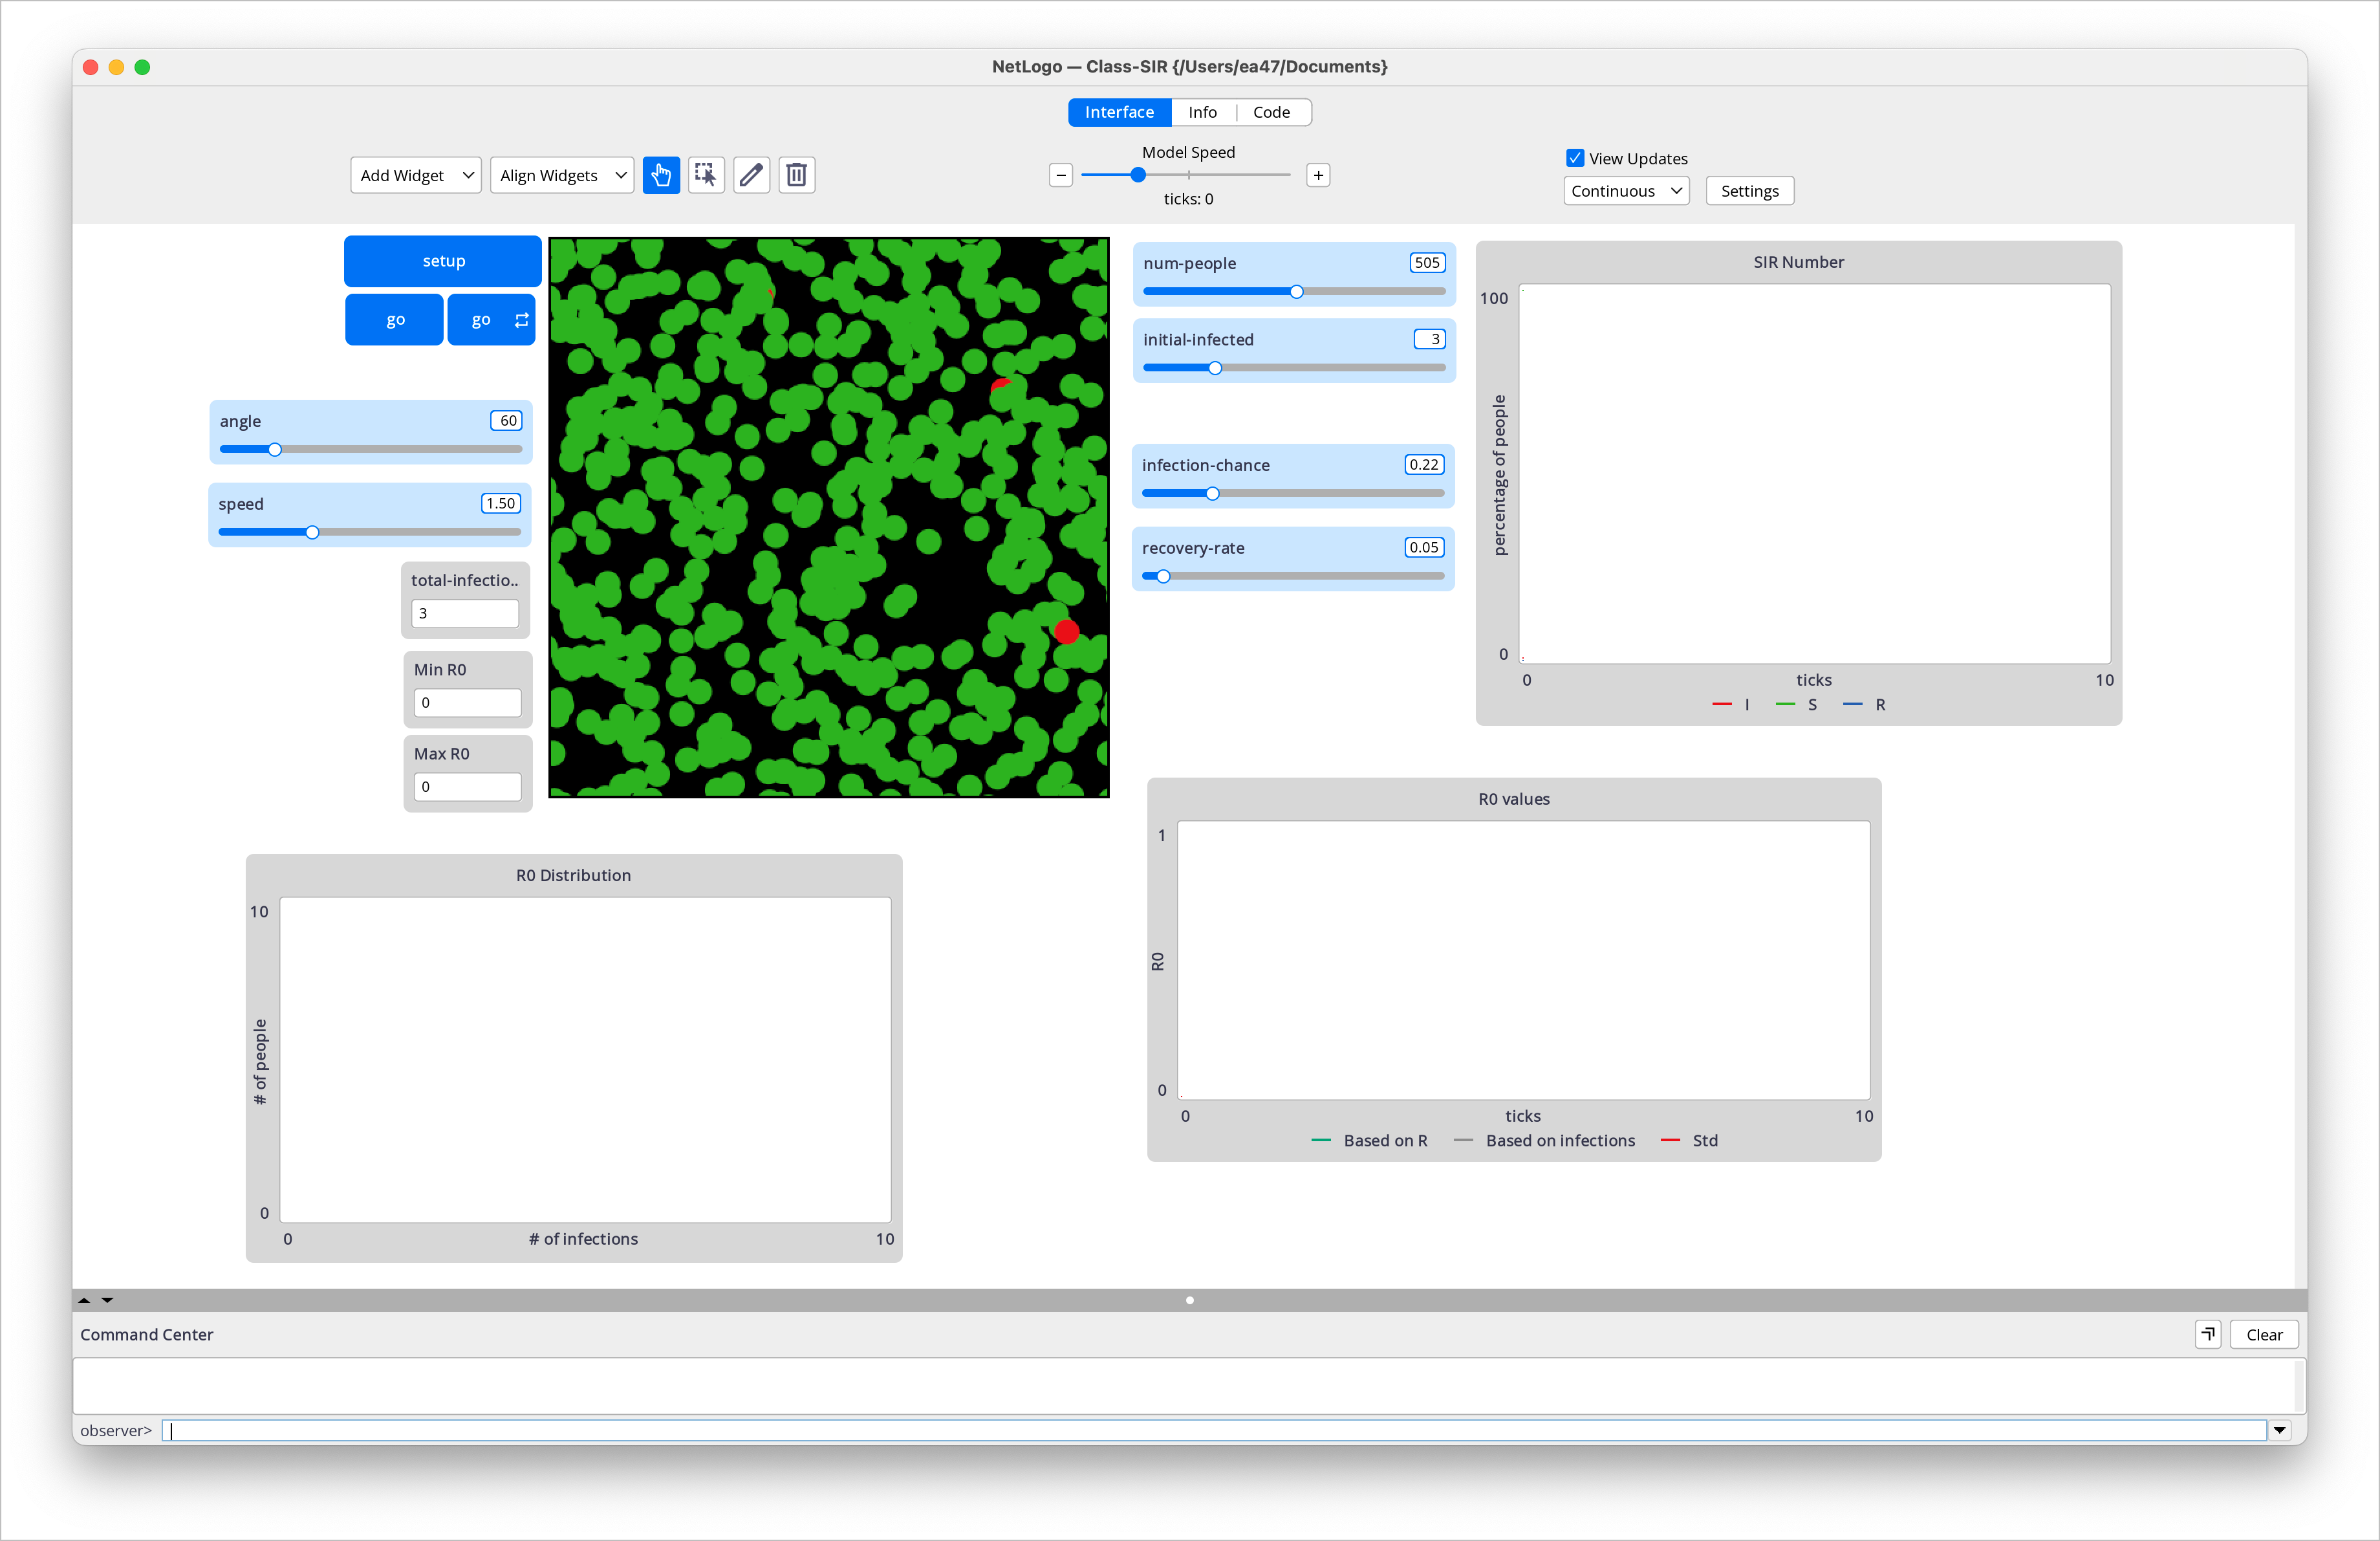
Interface for the SIR model.
globals[
  infected-counts   ; lists
  total-infections  ; lists
]

breed [people person]

people-own [
  infected?
  immune?
  infected-by
  num-infected ;; number of infections I have caused
  infection-time
  recovery-time
]
Besides the global variables, we also added a few properties to the agents. Each agent has an infected? property to indicate if they are currently infected, an immune? property to indicate if they have recovered and are immune, an infected-by property to track who infected them, a num-infected property to count how many agents they have infected, an infection-time property to track when they got infected, and a recovery-time property to determine when they recovered.
Below we have the setup procedure, which initializes the model.
;; SETUP PROCEDURES

to setup
  clear-all
  create-people num-people [
    set shape "circle"
    set size 1.5
    set color green
    set infected? false
    set immune? false
    set infected-by nobody
    set num-infected 0
    set infection-time -1
    set recovery-time -1
    setxy random-xcor random-ycor
  ]
  setup-infected
  set infected-counts []
  set total-infections initial-infected

  reset-ticks
end


to setup-infected
  ask n-of initial-infected people [
    set infected? true
    set color red
    set infection-time 0
    set infected-by nobody
  ]
end
The setup procedure initializes the model by clearing the world, creating the agents, and setting their initial properties. It also calls the setup-infected procedure to infect a certain number of agents at the start of the simulation. The infected-counts and total-infections lists are initialized to keep track of the number of infected agents over time.
Model Dynamics
Below is our code for the model dynamics, which includes the movement of agents, the infection process, and the recovery process.
to go
  move
  infect
  recover-infected

  if all? people [not infected?] [stop]

  tick
end

to move
  ask people [
    left random angle
    right random angle
    forward speed
  ]
end

to infect
  ;; SIR model
  ask people with [infected?] [
    ask people-here with [not infected? and not immune?][
      if random-float 1 < infection-chance [
        set infected? true
        set color red
        set infected-by myself
        set infection-time ticks

        set total-infections total-infections + 1

        ask myself [
          set num-infected num-infected + 1
        ]
      ]
    ]
  ]

end

to recover-infected
  ask people with [infected?] [
    if random-float 1 < recovery-rate [
      set infected? false
      set recovery-time ticks
      set immune? true
      set color blue
    ]
  ]
end
The go procedure is called at each time step and calls the move, infect, and recover-infected procedures. It also checks if there are any infected agents left; if not, it stops the simulation.
The move procedure updates the position of each agent based on its heading and speed. The infect procedure implements the infection process, where infected agents can infect susceptible agents in the same location with a certain probability. The recover-infected procedure implements the recovery process, where infected agents can recover and become immune with a certain probability.
Data Collection and Visualization
We are interested in knowing how the number of infected agents changes over time, as well as the values for R0 (R-naught) and the distribution of infections caused by each agent. We can use the infected-counts and total-infections lists to keep track of the number of infected agents over time and the total number of infections, respectively. We can also calculate R0 as the average number of infections caused by each infected agent.
Let’s start by calculating R0 based on the number of recovered agents and the number of infections they caused. We can create a reporter called calculate-R0 to do this.
to-report calculate-R0
  ;; from the immune people (those who have recovered)
  let recovered-people people with [immune?]
  ifelse any? recovered-people [
    ;; there are people in the R compartment
    report mean [num-infected] of recovered-people
  ][
    ;; agentset is empty
    report 0
  ]

end
Next, we can create a reporter called current-mean-R0 to calculate the current average R0 across all individuals who have infected at least one person.
to-report current-mean-R0
  ;; current average R0 across all individuals who have infected at least one person
  let infectors people with [num-infected > 0]
  ifelse any? infectors[
    report mean [num-infected] of infectors
  ][
    ;; no one infected anyone yet
    report 0
  ]
end
The next two reports, max-R0 and min-R0-nonzero, will help us track the maximum and minimum non-zero R0 values among individuals who have infected others. That is, the maximum and minimum number of people infected by a single individual.
to-report max-R0
  ;; maximum number of people infected by a single individual
  let infectors people with [num-infected > 0]

  ifelse any? infectors [
    report max [num-infected] of infectors
  ][
    report 0
  ]
end

to-report min-R0-nonzero
  ; minimum non-zero R0 value
  let infectors people with [num-infected > 0]
  ifelse any? infectors [
    report min [num-infected] of infectors
  ][
    report 0
  ]

end
We can also create a reporter called R0-distribution to return a list of all num-infected values for analysis. That will be used to create a histogram of the distribution of infections caused by each agent.
to-report R0-distribution
  ; return a list of all num-infected values for analysis
  report [num-infected] of people with [num-infected > 0]
end
Other stats are also interesting to track, such as the standard deviation of R0 values. We can create a reporter called R0-standard-deviation to calculate that.
to-report R0-standard-deviation
  ; standard deviation of R0 values
  let infectors people with [num-infected > 0]
  ifelse any? infectors [
    report standard-deviation [num-infected] of infectors
  ][
    report 0
  ]
end
Finally, we can create reporters to calculate the percentage of agents in each state (Susceptible, Infected, Recovered) at any given time. These reporters will be useful for plotting the SIR curves.
to-report percent-infected
  report (count people with [infected?] / num-people) * 100
end


to-report percent-recovered
  report (count people with [immune?] / num-people) * 100
end


to-report percent-susceptible
  report (count people with [not infected? and not immune?] / num-people) * 100
end
All these reporters can be used to create plots and visualizations in the Interface tab. For example, we can create a plot to show the SIR curves over time, with the x-axis representing time (ticks) and the y-axis representing the percentage of agents in each state. We can also create a histogram to show the distribution of infections caused by each agent.
You can investigate the plots and monitors by downloading and playing with our model here.