Let’s explore the four main areas of NetLogo. We will use the Traffic Grid model as an example, but these concepts apply to all models.
1. World View (where agents live and move)
This is the “stage” where your social drama unfolds
Agents appear as colored shapes that move and interact
Think of it as looking down at a city from above
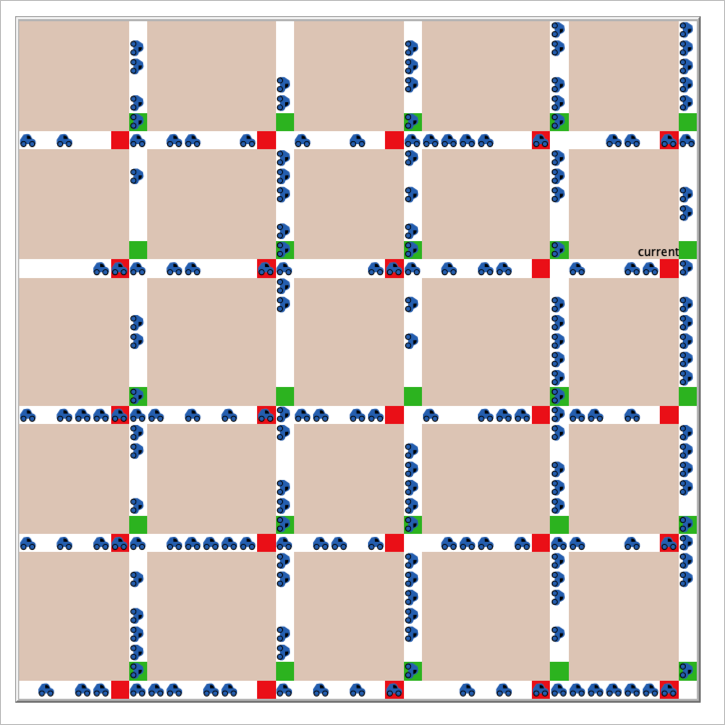
Traffic Grid model’s world view.
2. Interface Tab (buttons, sliders, plots you can interact with)
The Figure below shows a typical model interface:
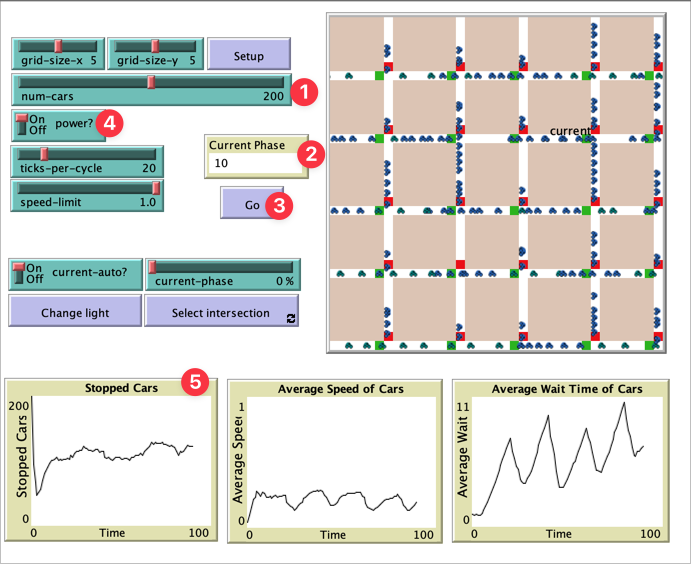
Example of a NetLogo model interface showing the visualization and controls.
Sliders (1): Adjust parameters like “how many people?” or “how fast do they move?”
Monitors (2): Display current values like “average wealth”
Buttons (3): Start, stop, and control your model
Switches (4): Toggle options on and off
Plots (5): Graphs showing data over time
3. Code Tab (where the magic happens - but don’t worry!)
Contains the “rules” that tell agents what to do
Uses English-like commands:
move-forward,turn-rightWe’ll start by reading code, not writing it
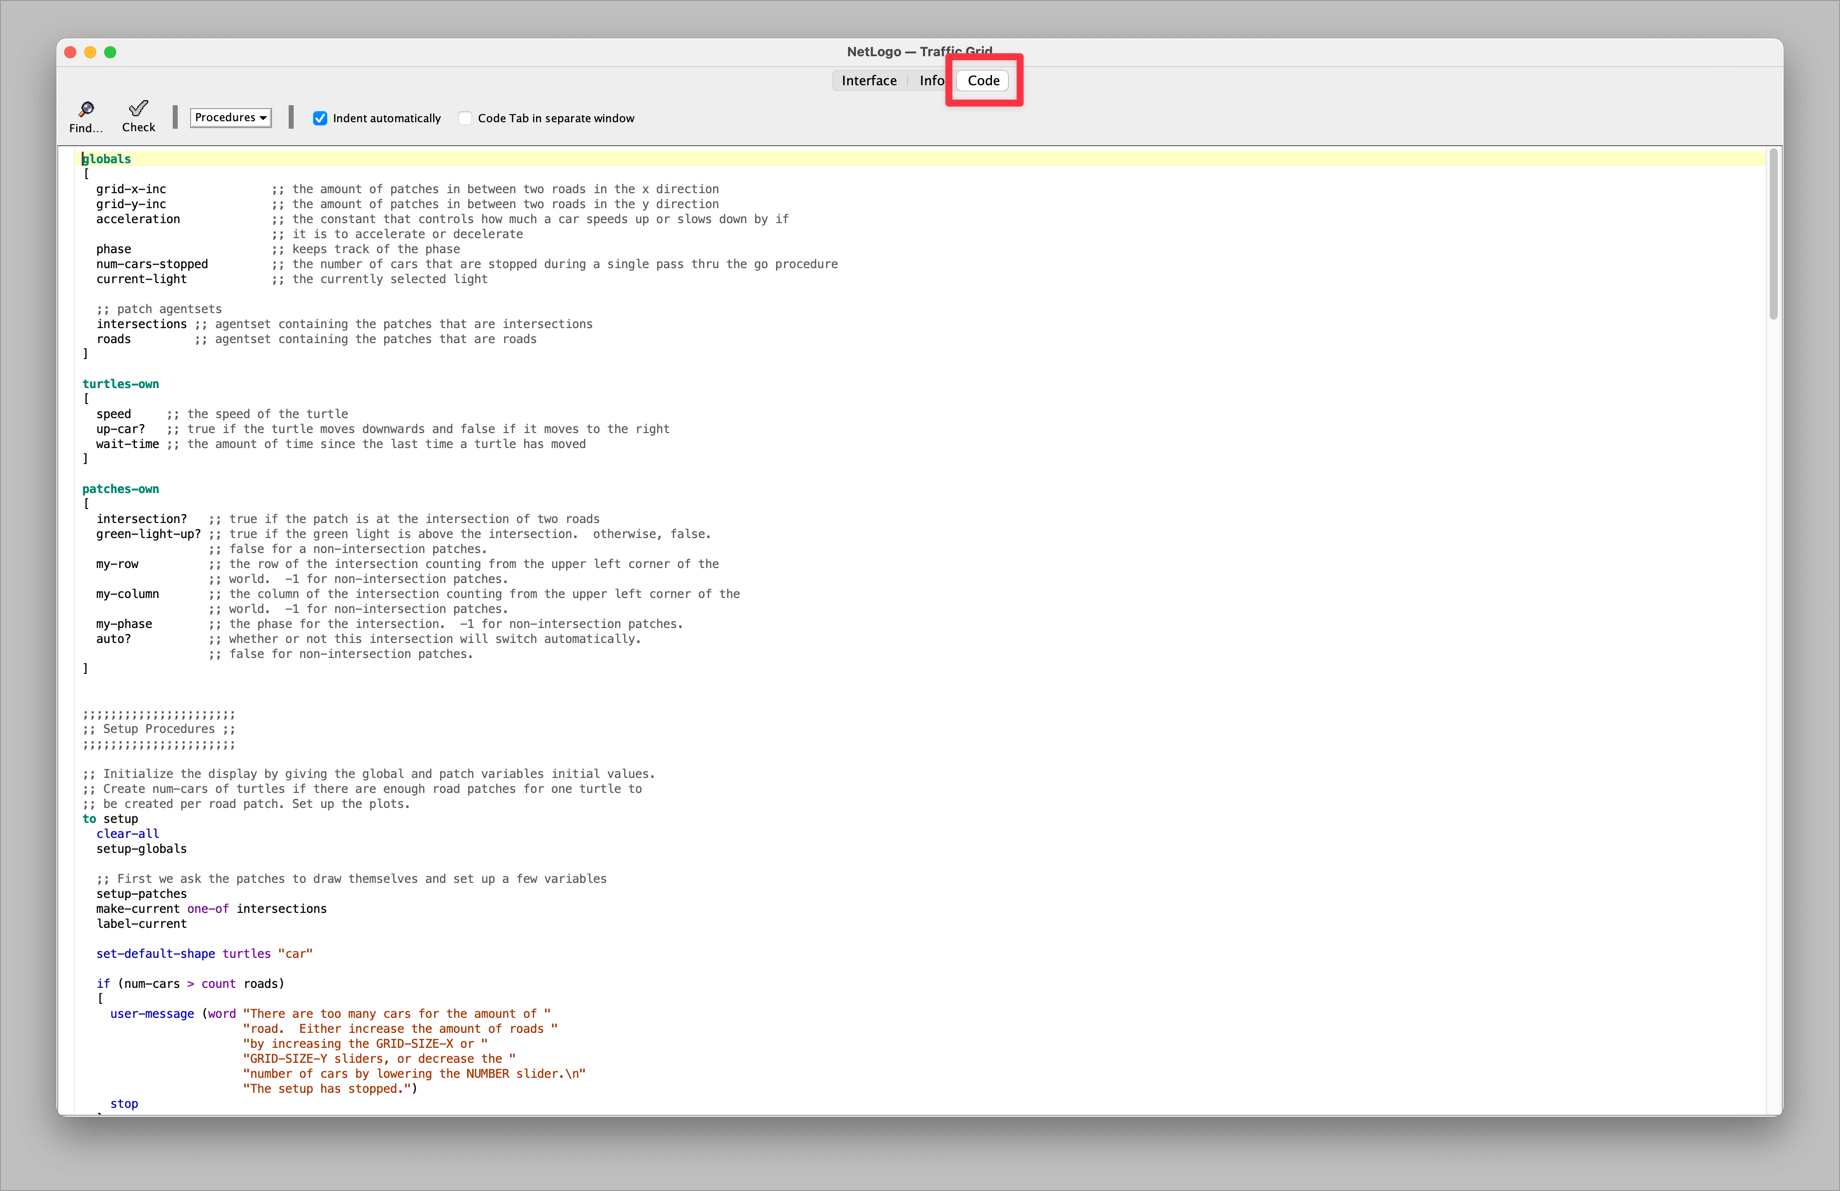
Example of a NetLogo Code tab interface showing the code for the Traffic Grid model.
4. Info Tab (documentation and explanations)
Always read this first when exploring a model!
Explains what the model does and what to look for
Provides background and references
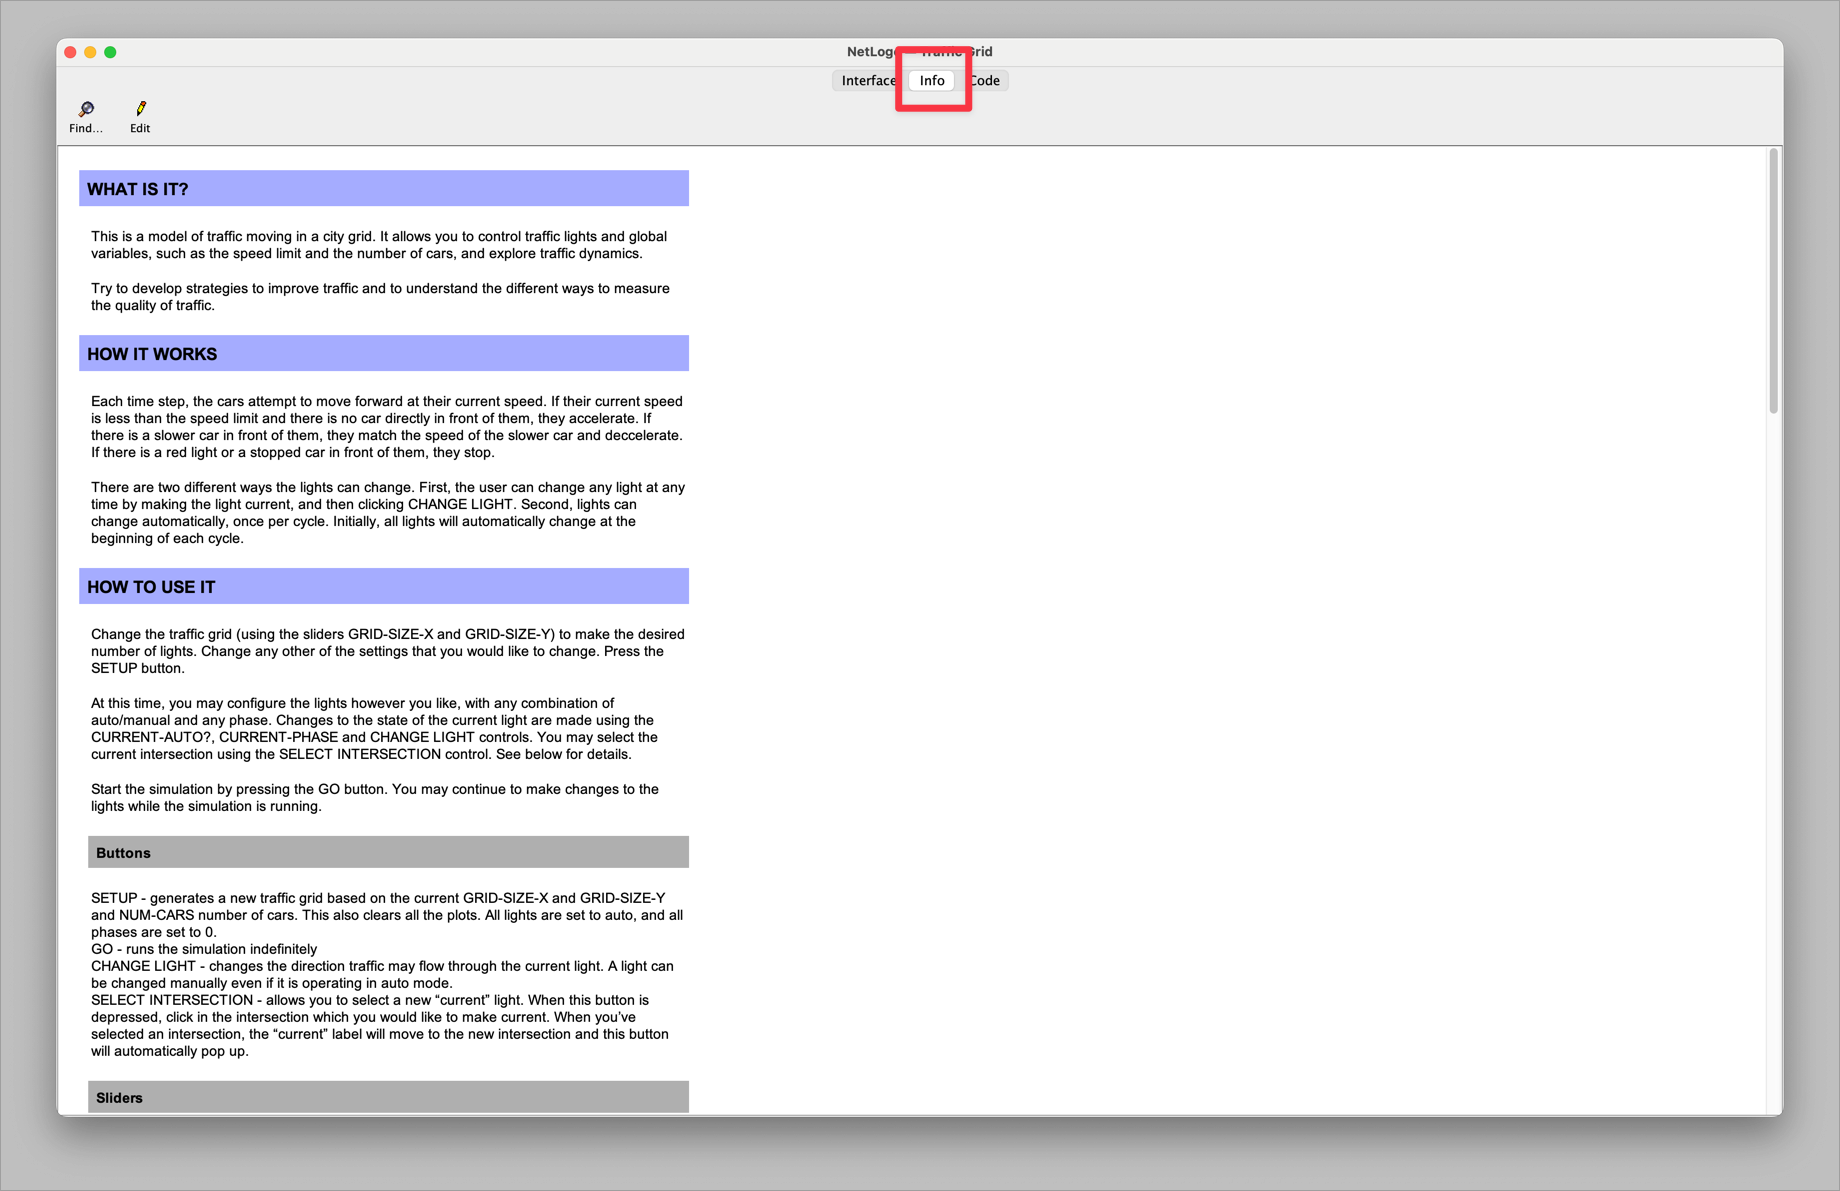
Example of a NetLogo Info tab interface showing model documentation and explanations.