Now that we have the basic functionality of the model set up, we can add some monitors and plots to visualize the state of the model as it runs. Monitors will allow us to see the number of happy and unhappy households in real-time, while plots can help us track changes over time. We are also interested in tracking the overall proportion of similarity in the population.
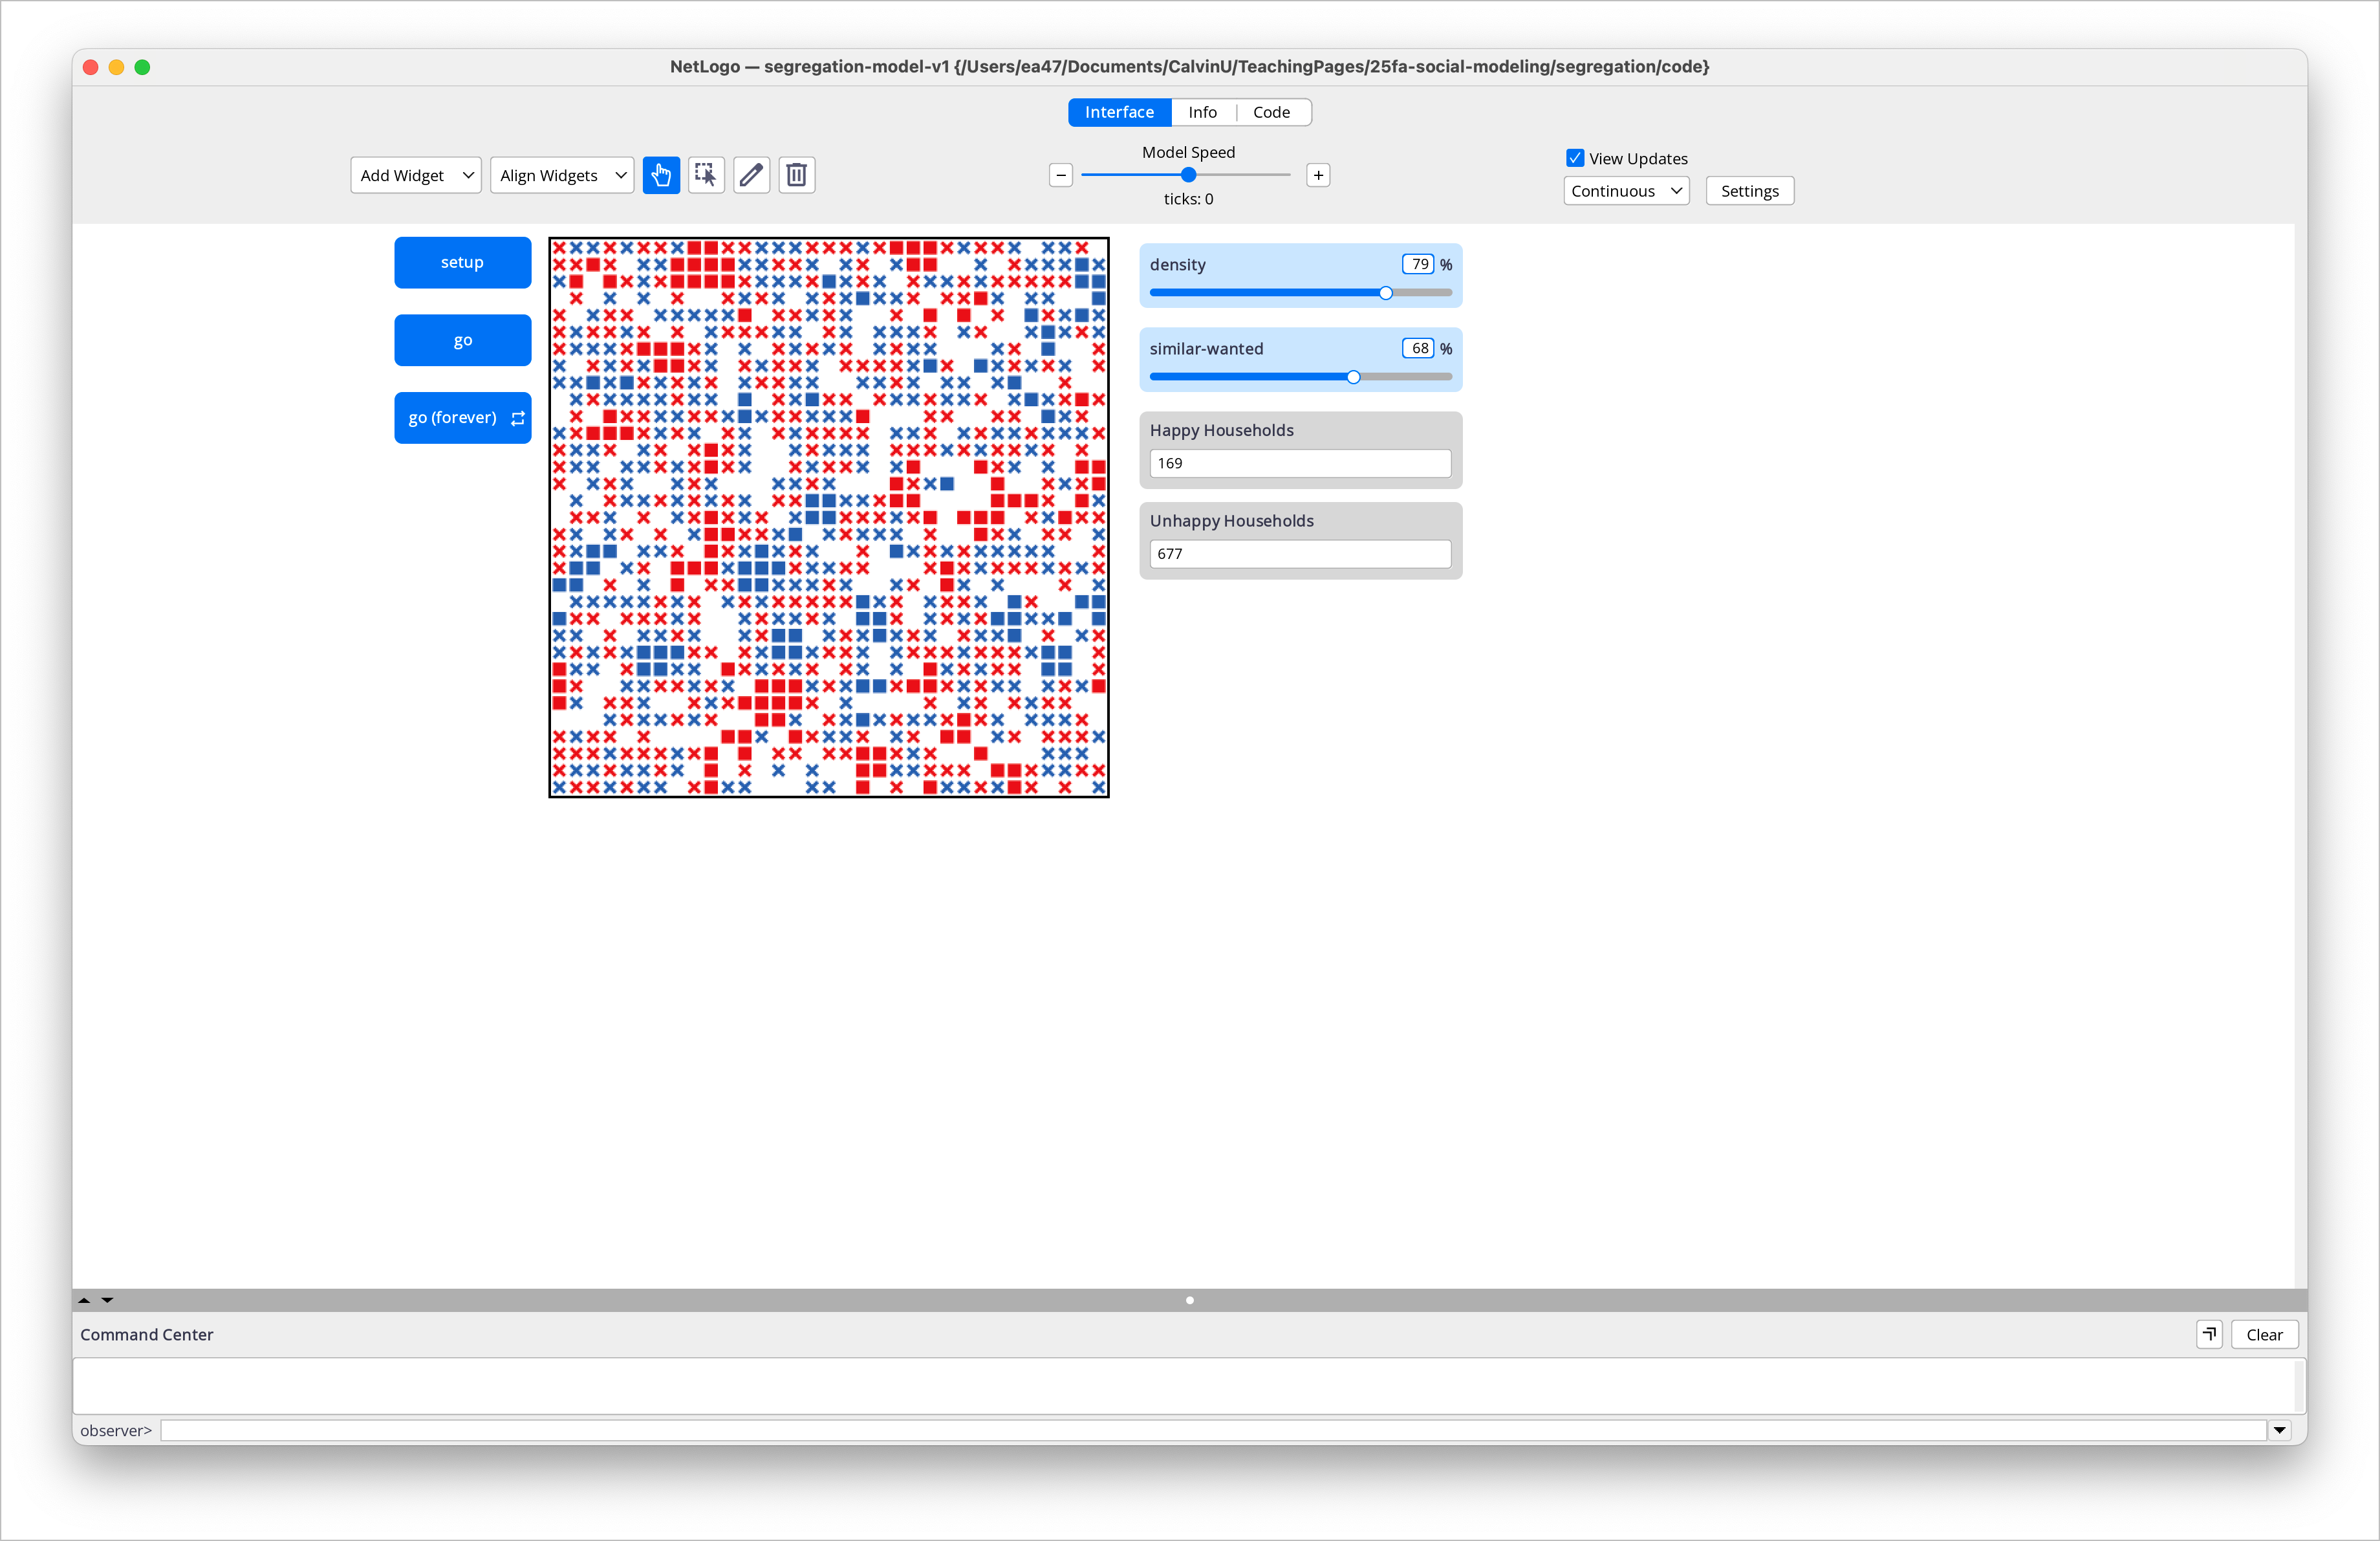
To add monitors, go to the Interface tab in NetLogo and create two monitors. Set the first monitor to display happy-households and the second monitor to display unhappy-households. This will allow us to see how many households are happy and unhappy at any given time during the simulation.
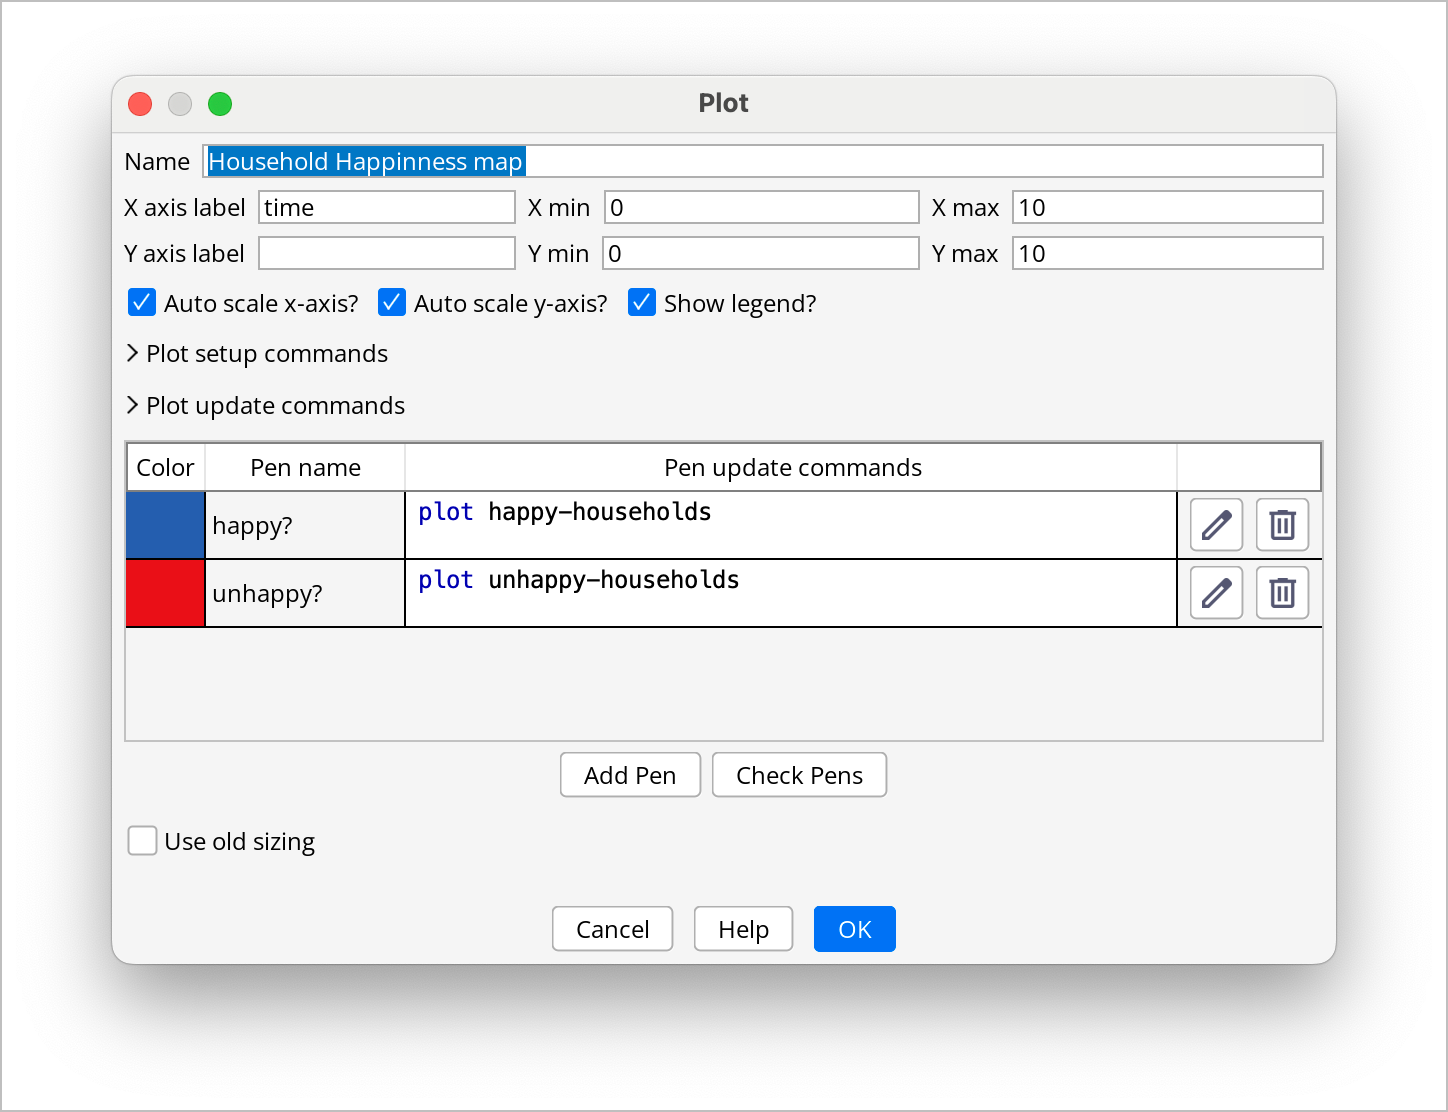
We also want to create a plot to visualize the number of happy and unhappy households over time. To do this, create a new plot in the Interface tab and set it up as follows:
Set the X-axis to represent time (ticks).
Add two Y-axes: one for the number of happy households and one for the number of unhappy households.
Add the following pens to the plot:
A pen for
happy-householdswith a color of your choice (e.g., blue).A pen for
unhappy-householdswith a different color (e.g., red).
Make sure to set the pens to “connected” so that we can see the trends over time.
Once you have set up the plot, you will be able to see how the number of happy and unhappy households changes as the simulation runs.
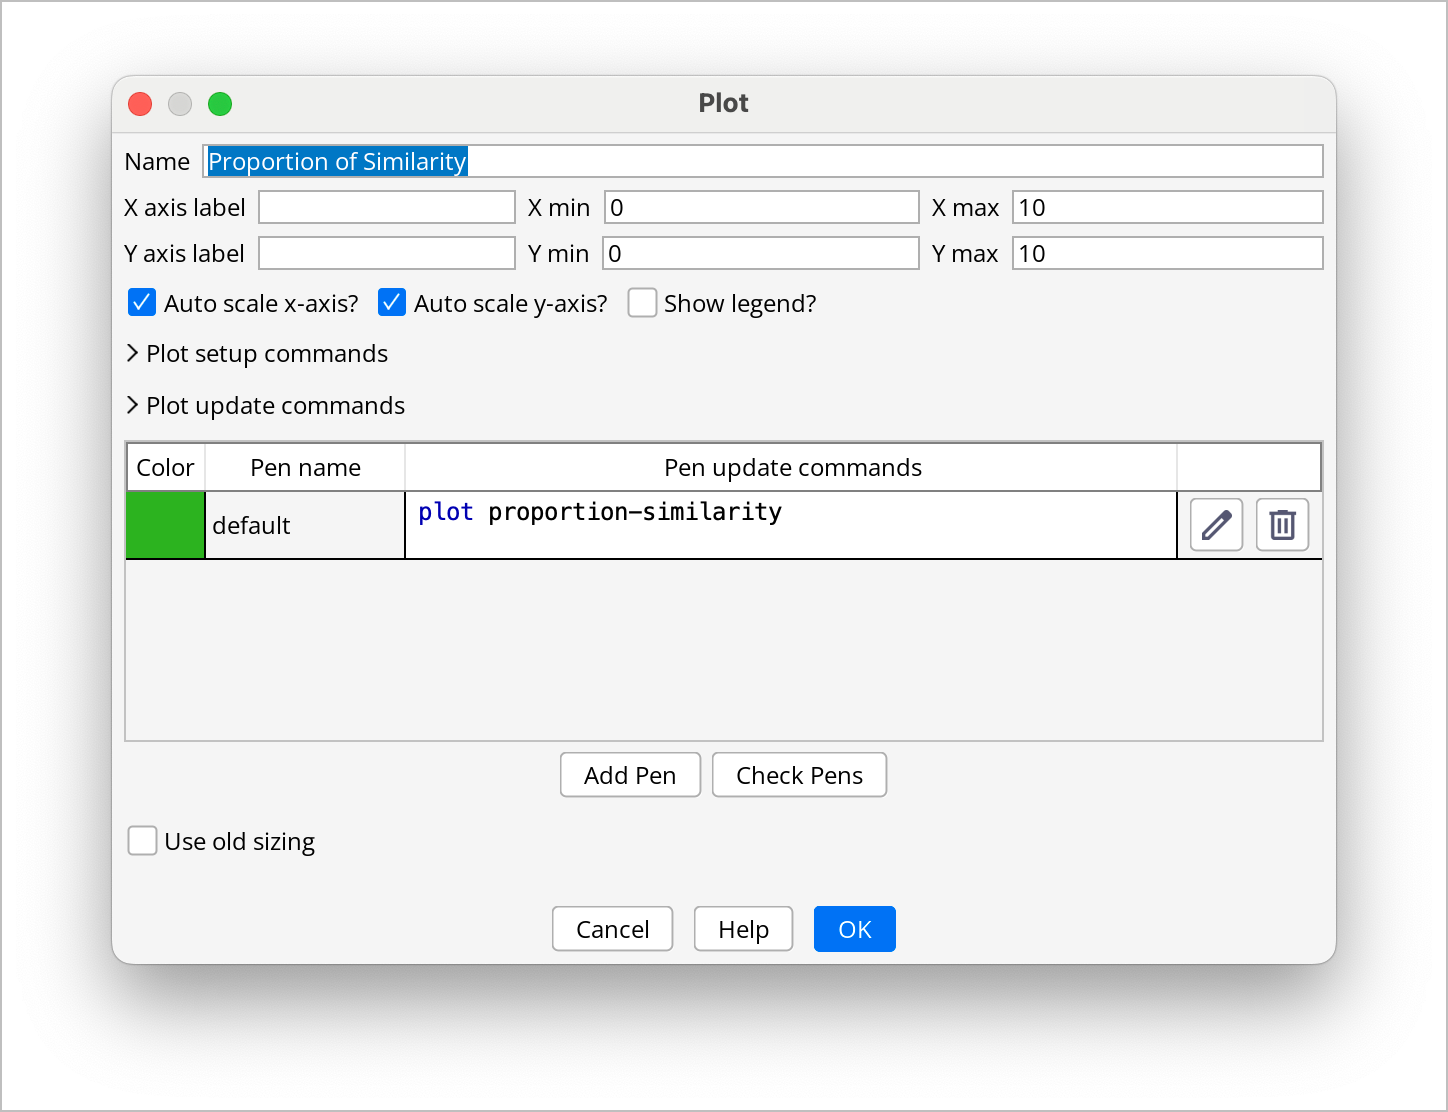
Finally, we want to add a monitor to track the overall proportion of similarity in the population. Create a new plot and set it to display proportion-similarity. This will give us insight into how similar the households are on average as the simulation progresses.
Now that we have added monitors and plots to our model, we can run the simulation and observe how the households move around the environment until they are all happy. The monitors will provide real-time feedback on the number of happy and unhappy households, while the plots will help us visualize the dynamics of the model over time.